Can statistics and data visualization save lives?
By Larissa Cury
May 13, 2024
May 12th is coined as The International Nurses Day in the memory of Florence Nightingale’s birth. Nightingale is considered the founder of Modern Nursing due to her unestimated contribution to the field back to the mid-1800s. If you have ever wondered why we should put an effort into studying stats and effective data visualization, please give Nightingale’s story a chance to convince you! 📅📝👩⚕️
To put in a nutshell, she became especially famous by focusing on data and data visualization while caring for wounded soldiers during the Crimean War (1853 - 1856). Two centuries ago! Provided with the data, she tracked the treatment of diseases as well as their spread. Importantly, this documentation made it possible to reduce the preventable deaths among soldiers that were due to unsanitary and unhygienic conditions.
As Mukherjee (2022) notes:
Her emphasis on data, data visualization and data interpretation was not to get a detailed account of deaths but to save lives through a data segregation approach to find out causes of death which could be prevented through reforms (Mukherjee, 2022, p. 6)
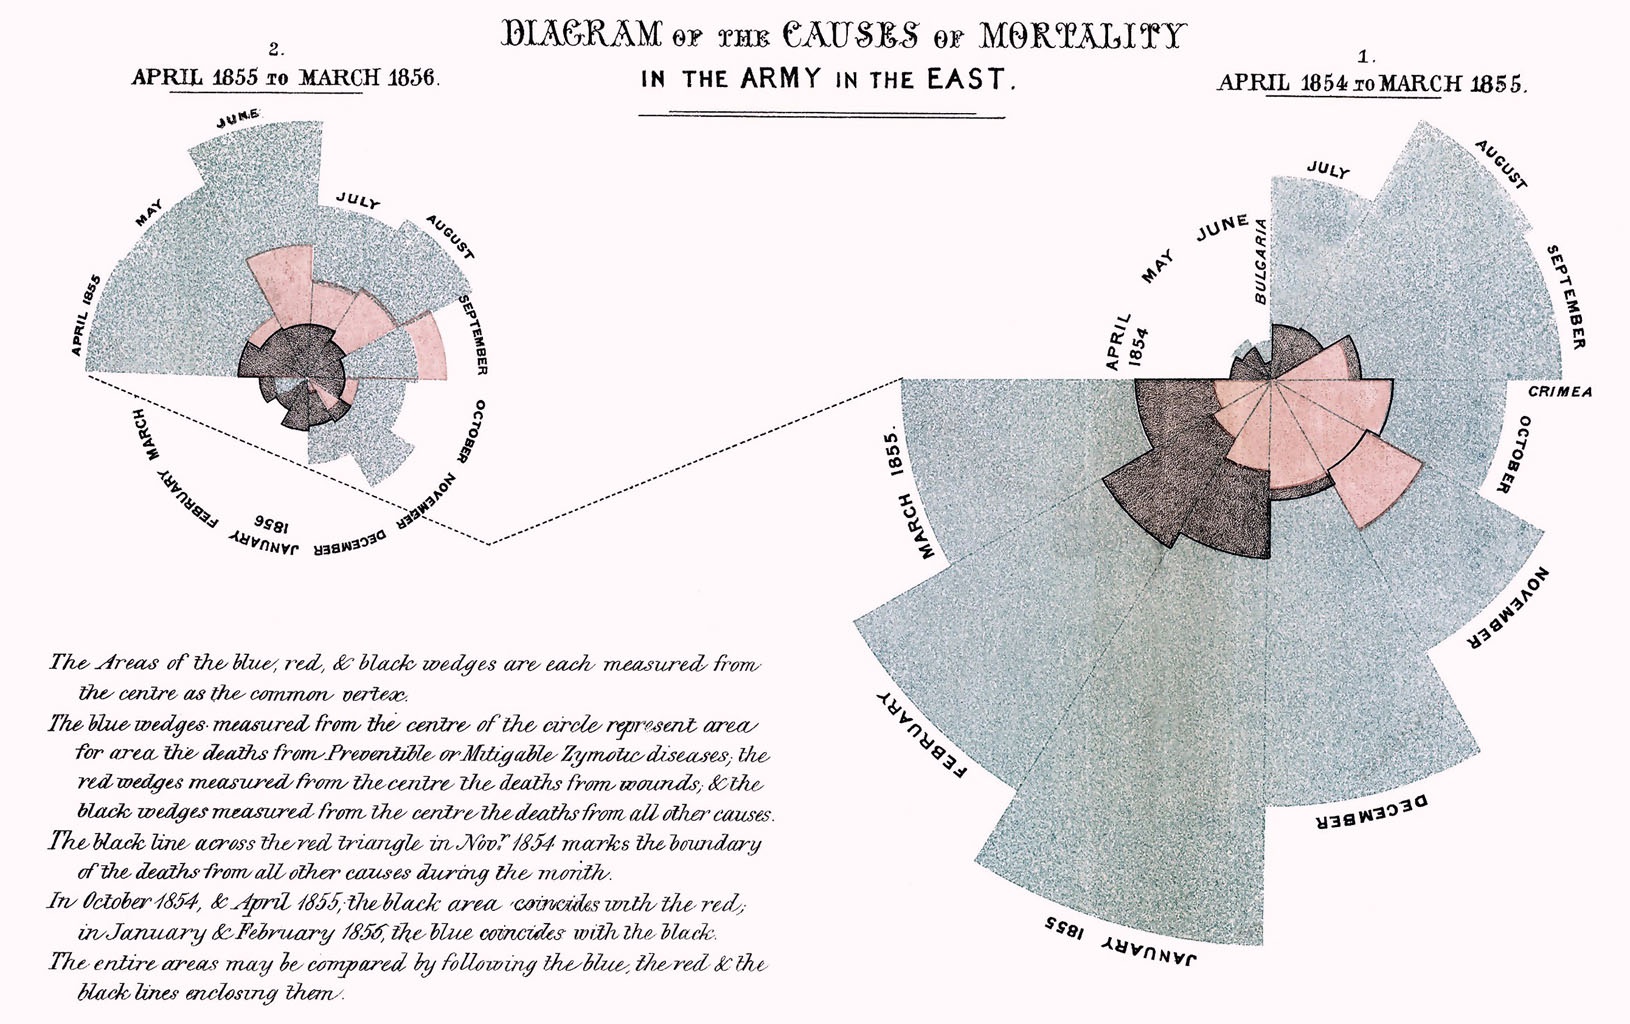
One of her greatest’s contributions was the so-called “Rose diagram” (or “cox-comb” - below). Nightingale’s diagram depicted the causes of mortality during the Crimean War for every two months over two successive years. In the diagram, the blue areas represent deaths from preventable causes related to hygiene; red ones represent deaths due to the War; the black areas, in turn, represent deaths from other causes.
As Mukherjee (2022) highlights, at the time, most statisticians would use tables in order to represent data. This is how effective data visualization supports its understanding, especially if we think of people (i.e, politicians, laymen) who do not understand the data itself.
Moreover, still in consonance with Mukherjee (2022), the diagram makes it clear a) how much Nightingale’s implementations and reforms sought an effect from one year to the other by reducing the number of deaths and b) how preventable diseases could cause more deaths than the war itself.
For a more accountable approach to her work, I strongly recommend Mukherjee’s chapter in Directional Statistics for Innovative Applications: a bicentennial tribute to Florence Nightingale (2022). Nightingale’s contributions prevail until nowadays. There are also some short videos on Youtube provided by the History Channel.
🐕 My name is Crystal, Nightingale’s story and contributions reinforce how statistics and effective data visualization are crucial to our lives!
References:
Bradley University. Florence Nightingale: Founder of modern nursing. Available at: here. Accessed in: May, 2024.
Mukherjee, S. P. Florence Nightingale: Quality of Life and Statistics. In: SenGupta, A; Arnold, B; C. Directional Statistics for Innovative Applications: a bicentennial tribute to Florence Nightingale. (2022). Springer, p. 3-12.
- Posted on:
- May 13, 2024
- Length:
- 3 minute read, 446 words
- See Also: