Day #02: lines
Day2: plot a map with lines
By Larissa Cury in R
November 2, 2022
Day2’s category is: lines. Let’s remember that counting yesterday’s map, this is my second map ever made with ggplot2 , so , please, keep on going easy on me 😅 . You should be able to access the whole
script here 😃
Day2: lines
Following a SO’s post
I researched a bit about how would I be able to plot rivers and I found this SO post very useful
Ploting world’s rivers
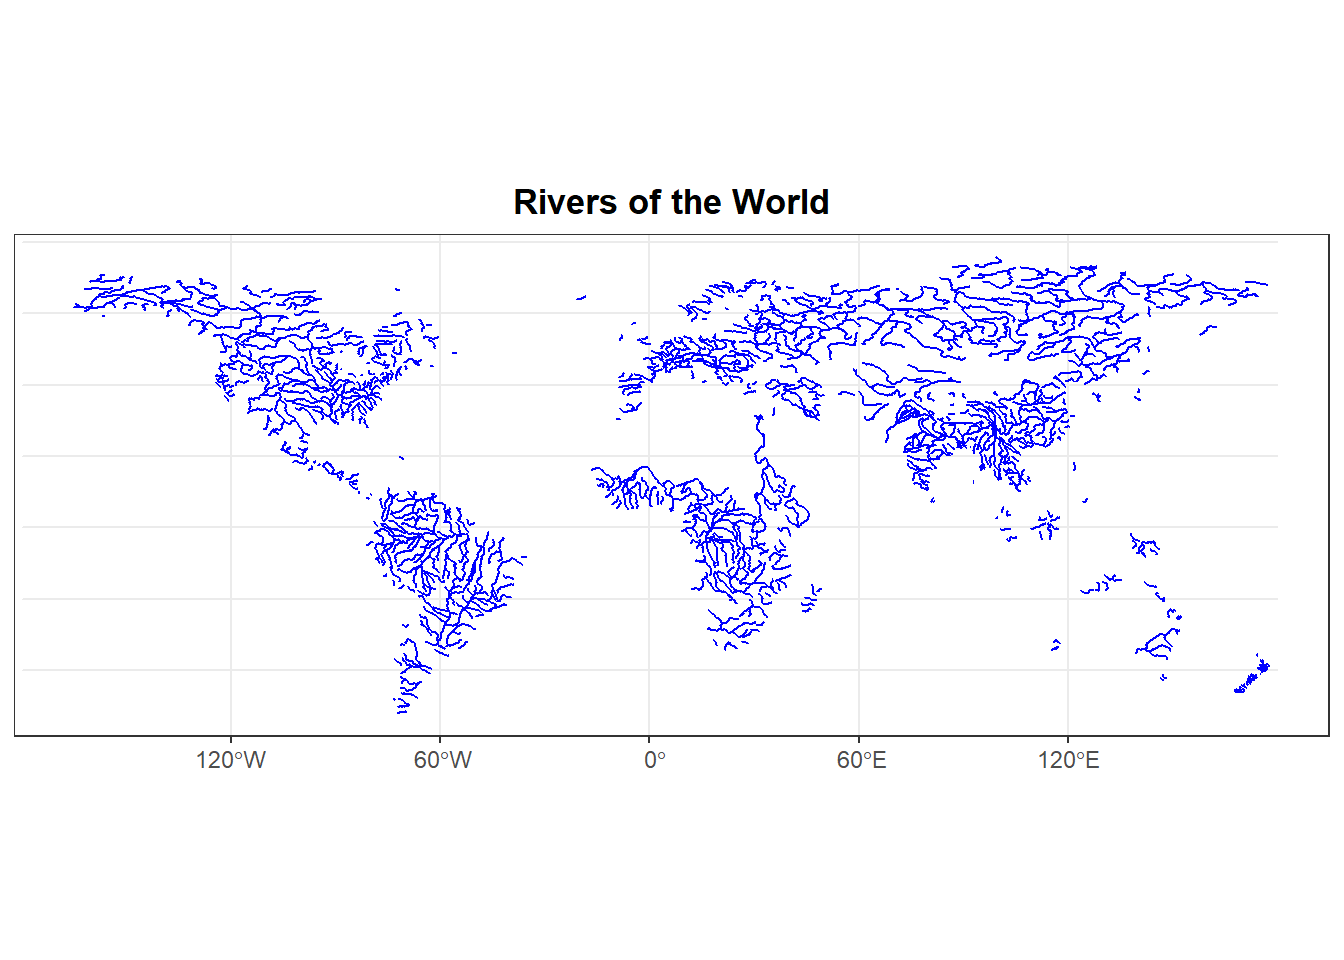
Following the post and some further research, I tried to first plot Brazil’s rivers, but I wasn’t able to do that (I’ve attempted to, tho). So, any suggestions on how I’d be able to do that would be very appreciated. That being said, I really wanted to follow the trend, so I made a very humble and simple map with the world’s rivers:

Enough talking! Let’s check the code out?!
Step 1: Load the relevant packages:
### Maps challenge

library(sf)
library(tidyverse)
# library(maps)
# library(ggspatial)
library(rnaturalearth)
library(rnaturalearthdata)
# library(rnaturalearthhires)
# devtools::install_github("AndySouth/rnaturalearthhires")
Step 2: download river’s information:
### Download info:
rivers <- ne_download(scale = 10, type = 'rivers_lake_centerlines',
                        category = 'physical', returnclass = "sf")
## OGR data source with driver: ESRI Shapefile
## Source: "C:\Users\laris\AppData\Local\Temp\RtmpW2Bt2R", layer: "ne_10m_rivers_lake_centerlines"
## with 1473 features
## It has 38 fields
## Integer64 fields read as strings:  ne_id
### plot the whole df if you want to:
## plot(rivers)

### some attempts to plot the rivers within Brazil's borders:
### As yesterday's map, filter Brazil:

# BRA <- ne_states(country = "Brazil", returnclass = "sf")

### link: https://gist.github.com/graydon/11198540

# brazilRivers <- st_crop(st_as_sf(rivers), xmin = -73.9872354804, xmax = -33.7683777809,
#                           ymin = -34.7299934555, ymax = 5.24448639569)
Step 3: plotting a very simple ggplot2 map:
day2 <- ggplot() + geom_sf(data = rivers, col = 'blue') +
labs(title = 'Rivers of the World') +
theme_bw() +
theme(plot.title = element_text(hjust = 0.5, face = "bold"))

### attempt to plot Brazil's:

# ggplot() +
#     geom_sf(data = BRA) +
#     theme_bw() +
#     geom_sf(data = brazilRivers, col = 'blue')
Step 4: Visualize it:
Here it goes!
day2
This is a very basic map, any suggests are always welcome! My background is in Linguistics, so I’ve never thought I’d be ploting maps, but I’m really enjoying it! Make sure to check the others maps out on twitter using the hashtag #30DayMapChallenge 😆
🐕 Au-au! Today we’ve made our second map using ggplot2 in order to complete the #30DayMapChallenge. We’ve found an useful SO post and followed some of its ideas. Today’s category was lines, so we’ve plotted a map to indicate rivers locations around the world. The plot is very simple, but it’s a start, right? Should we say: mission accomplished?! See you soon!